Do you like games? I do. And more and more people are becoming video game players each year. With such a large and ever-increasing community, there are all sorts of games as well as gamers all around the world. They compete, exchange, and make friends in this fantastic virtual world. It has become such a large eco-system that one can easily find their favorite classics or categories in the world of gaming if enough time is spent. However, unlike games, people are rather difficult to be defined and categorized concerning their behaviors and learning patterns.
With visual analytics to assist game analyses, it is possible to expose the under-explored facets of player behaviors, especially when considering factors beyond basic actions and scores.
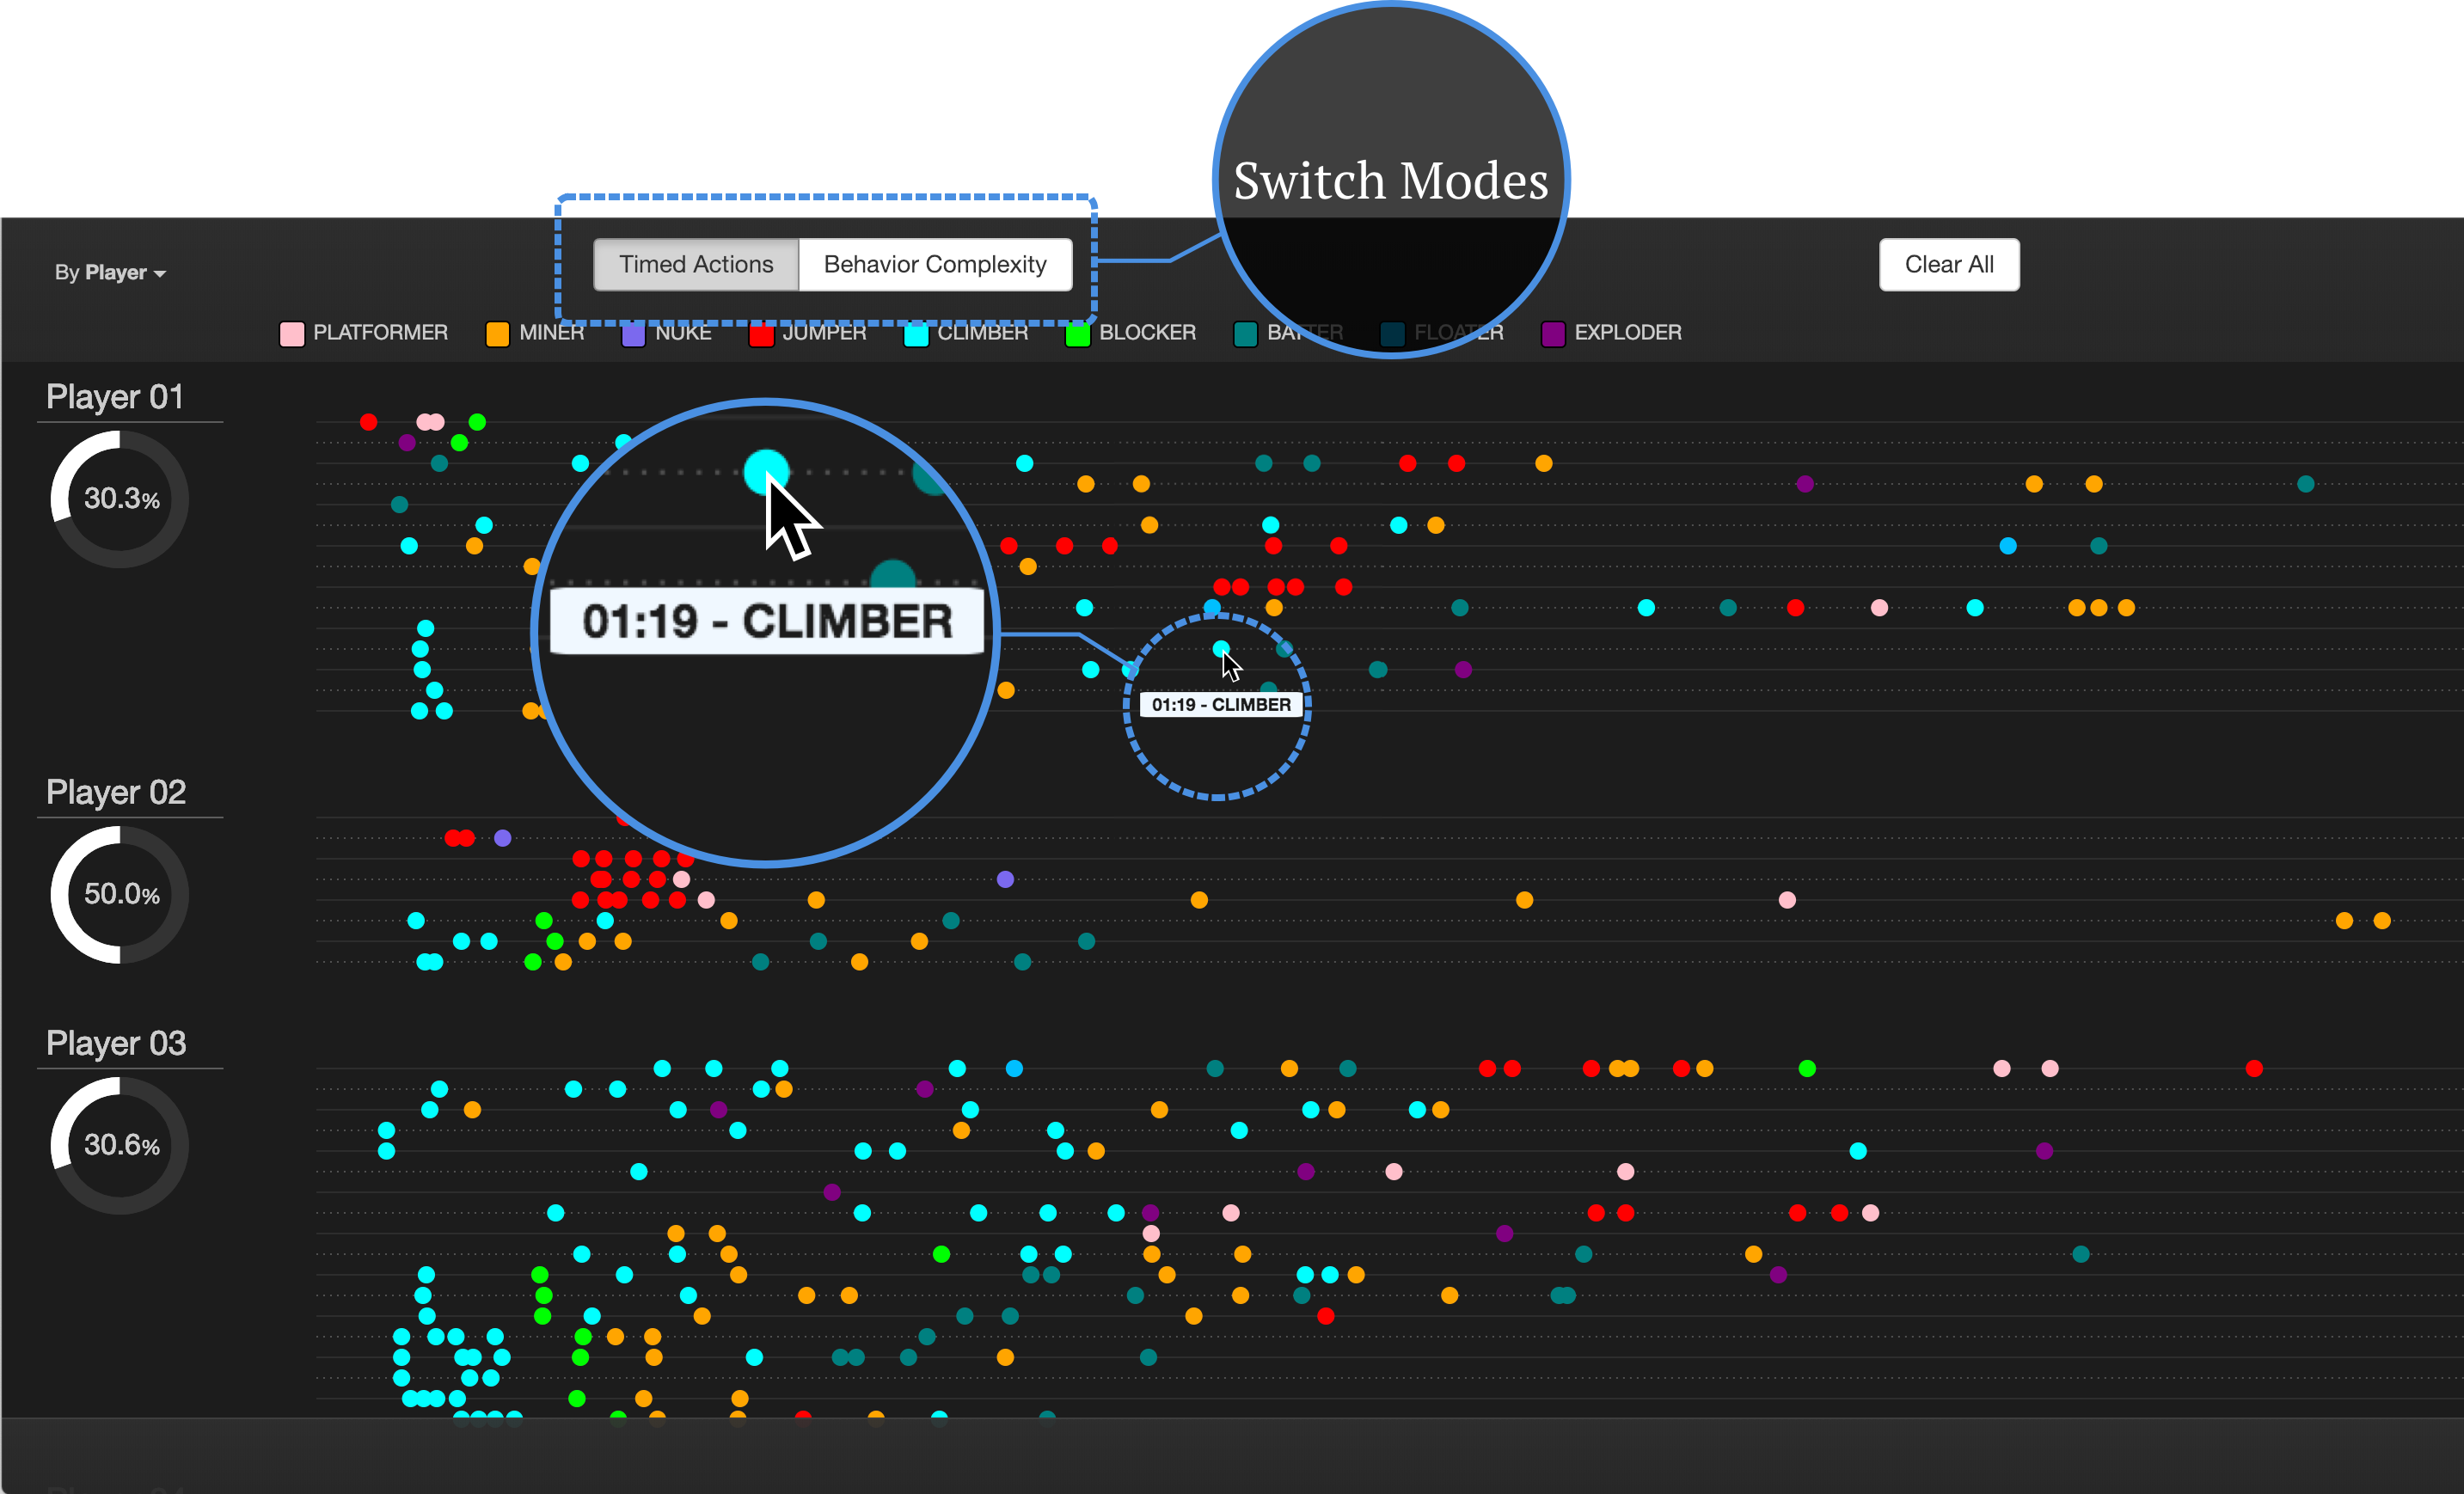
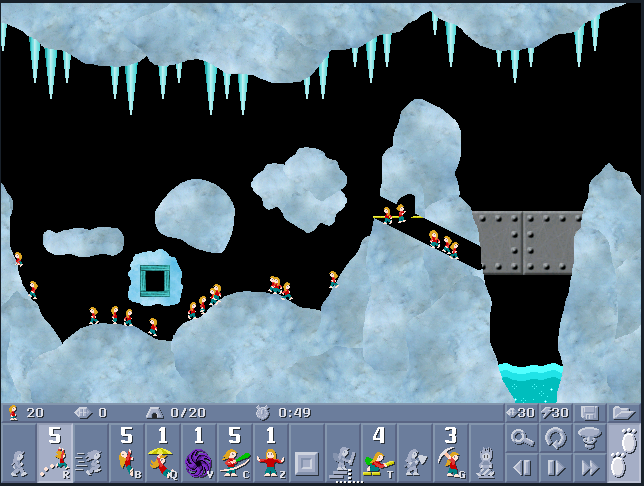
In the presented case here, we crafted delicate visual elements to display types and occurrences of player actions in a puzzle game - Lix (an open source deviation of Lemmings). The actions are color coded as dots. User are provided with the option to display actions in time or condense them as series of actions sequences. Since each player have multiple attempts to solve a stage. Actions of the same attempt is sorted as a horizontal line.
This design provides basic plots of data points. To improve decision making that answers to the problems of understanding player behavior. We need new fresh angles to the data --- the complexity within one attempt and similarities between strategies in multiple attempts.
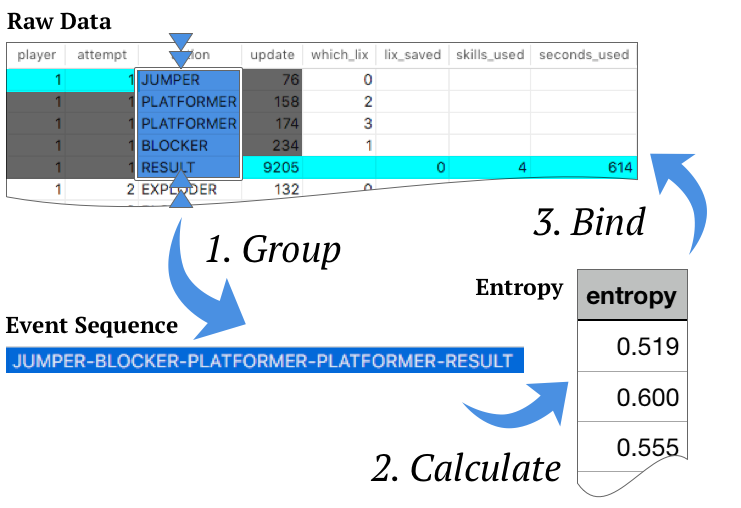


User can leverage the glyph "signature" to distinguish or assimilate the strategies of each consecutive attempts. With entropy based modeling, we also extracted the complexity of moves and plotted their variations against score numerics. The raw data is collected from novice player who had near zero experience with the game. Thus, gradual or acute switching of action combinations in the learning progress are presented to examine. We can also see how players are reducing unnecessary moves and building more sophisticated solutions on the go.
Prototype Access.
More in the paper:
W. Li, M. Funk, Q. Li, and A. Brombacher, “Visualizing Event Sequence Game Data to Understand Player’s Skill Growth through Behavior Complexity,” J Vis, May 2019.